
Commute Times Approaching Pre-Pandemic Levels as Remote Work Slightly Declines
- The average national commute time in 2024 was 27.2 minutes – 0.4 minutes lower than in 2019, but 0.4 minutes higher than in 2023.
- New York City commuters spent the most amount of time on their way to work in 2024, 40.6 minutes – 0.5 minutes more than they did in 2023.
- Tulsa, OK takes the lead as the city with the best commute, with only 19.7 minutes for a one-way trip.
- While the number of remote workers is still significantly higher in 2024 than before the pandemic, it has dropped by 1.9%, or over 400,000 workers, compared to 2023.
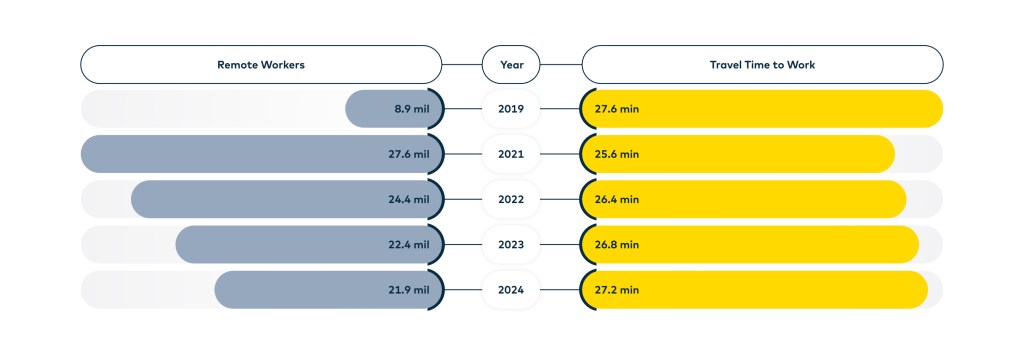
Over the past several years, the daily commute has become a powerful indicator of how the American workplace continues to evolve. What was once a predictable routine was dramatically disrupted by the rapid shift to remote work during the COVID-19 pandemic. Millions traded highway traffic on the way to work for home offices, redefining where and how work gets done. Yet as companies reestablish in-person operations and hybrid schedules, the familiar rhythm of commuting is steadily returning. Recent U.S. Census data provides a clear view of this transformation. In 2019, before the pandemic, the average one-way commute time stood at 27.6 minutes. By 2021, when remote work reached its peak with over 27.6 million Americans working from home, average commute times fell to 25.6 minutes, the lowest in recent history.
As organizations began phasing employees back into the workplace, the balance shifted once again. The number of remote workers declined to 24.4 million in 2022, pushing the average commute time up to 26.4 minutes. A year later, the trend persisted: 22.4 million remote workers and an average commute of 26.8 minutes. By 2024, commuting patterns had nearly returned to pre-pandemic levels. The typical one-way trip to work now averages 27.2 minutes, while the remote workforce continues to shrink slightly, to just under 22 million people. These figures underscore a continuing recalibration between flexibility and office presence, as employers and employees alike navigate what the “new normal” of work truly means.
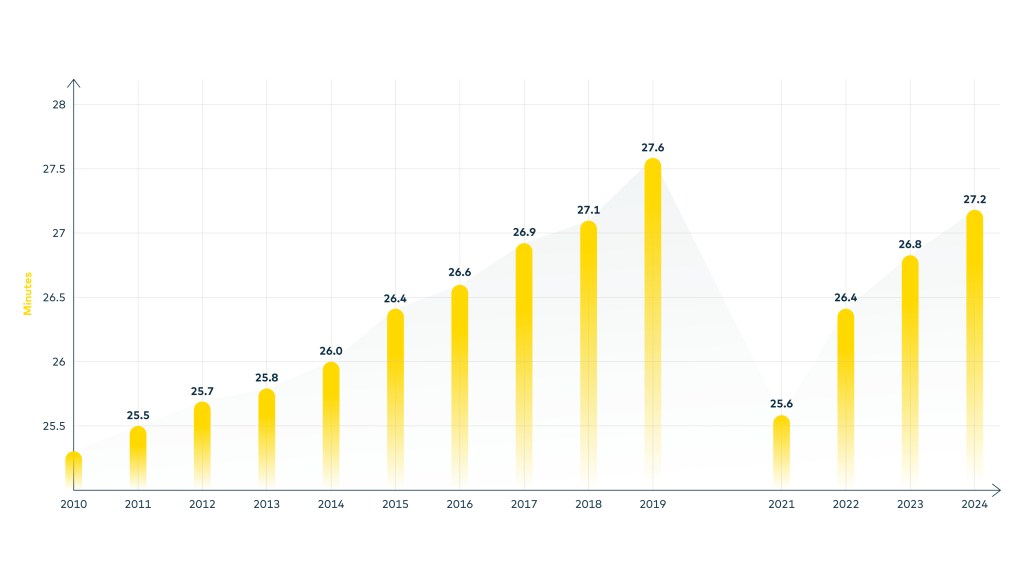
Travel Time (2010–2024)
Commute Times Increase in a Hybrid Work Era
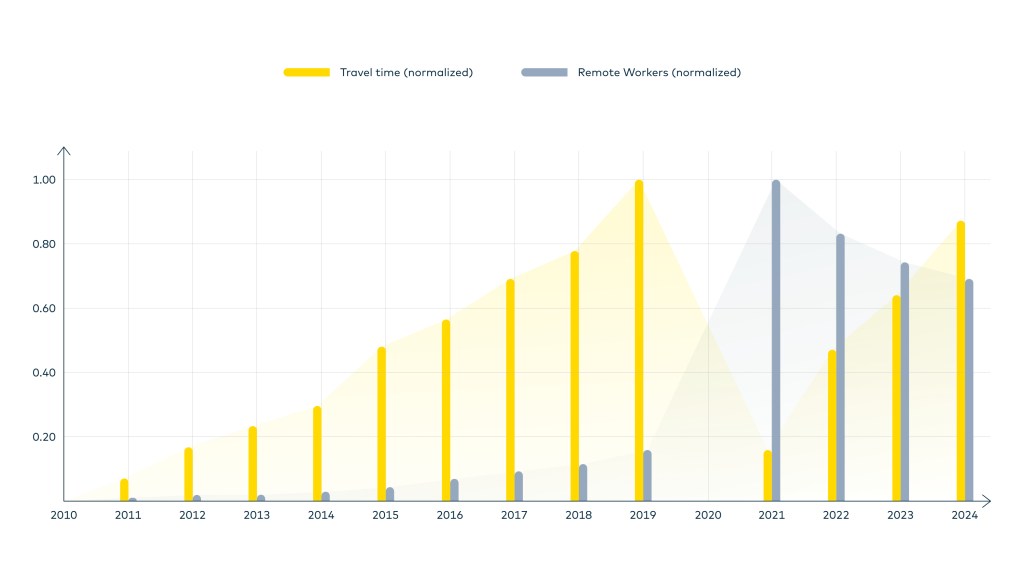
The data reveals a consistent pattern: as remote work continues to recede, commute times are climbing at a noticeably faster pace, underscoring just how deeply remote and hybrid work models have influenced modern work-life dynamics. What’s particularly striking is that the post-pandemic rebound in commuting is far steeper than the gradual increases seen before 2020. Between 2011 and 2019, the average one-way commute inched up from 25.5 to 27.6 minutes – an increase of just over two minutes across eight years, or roughly 0.26 minutes per year. By contrast, the years following the pandemic tell a different story. After dipping to 25.6 minutes in 2021 amid the height of remote work, average commute times climbed sharply to 26.4 minutes in 2022, then to 26.8 minutes in 2023. The latest figures from 2024 show an even further rise to 27.2 minutes, marking a total increase of 1.6 minutes in just three years. This acceleration effectively condenses more than six years of pre-pandemic growth into a fraction of the time, illustrating how swiftly commuting behavior is reverting as more employees return to physical workplaces and remote options narrow.
Remote Workers & Commute Time Trends (2010-2024)
The most recent data reinforces the continued realignment of the American workforce as remote work participation slowly declines while total employment expands. Between 2023 and 2024, the total number of U.S. workers increased by 1.8%, rising from 162.4 million to 165.4 million, signaling steady labor market growth. At the same time, the share of employees working remotely fell from 13.8% to 13.3%, effectively declining with 1.9% year over year.
This downward trend in remote work participation reflects an ongoing recalibration of workplace dynamics from the pandemic’s peak. In 2019, only 5.7% of the workforce worked remotely, a figure that surged to 17.9% in 2021 as remote arrangements became the norm for many. However, subsequent years have seen a gradual but persistent retreat from that high, with remote work accounting for 15.2% of workers in 2022, 13.8% in 2023 and 13.3% in 2024. While remote work remains a lasting component of the employment landscape, its share is steadily decreasing as more organizations reinforce hybrid or in-person work models.
New York City, 0.4 Minutes Closer to Pre-Pandemic Commute Time
In 2024, long commutes remained a defining challenge in many of America’s largest metropolitan areas, with New York City once again topping the list. The average one-way travel time there climbed slightly from 40.1 minutes in 2023 to 40.6 minutes in 2024, reaffirming its position as the U.S. city with the longest commute. Chicago, IL followed with an average of 33.5 minutes, up half a minute from the previous year. Several other major cities also saw notable increases, including Philadelphia, PA, where commute times rose sharply from 31.1 to 33.2 minutes, and Boston, MA, which experienced a similar jump from 30.2 to 31.7 minutes, climbing five places in the ranking for worst commute. Even Baltimore, MD, which had one of the shortest commute times among the top ten in 2023, recorded a steep increase of 1.7 minutes, reaching 30.2 minutes in 2024. These widespread upticks suggest that urban commuting pressures are intensifying once again, likely fueled by higher return-to-office rates, population growth and increased congestion on public transit and roadways.
While 2023 showed hints of improvement in some cities, that progress largely reversed in 2024. San Francisco, CA, for instance, saw its average commute extend from 30.9 to 32.2 minutes, a rise of 1.3 minutes, while Los Angeles, CA inched up from 31.4 to 31.7 minutes. Long Beach, CA and Oakland, CA both experienced similar upticks, reaching 31.2 minutes on average. Even Washington, D.C., which had shown signs of stability in 2023, edged higher to 31.0 minutes in 2024. Collectively, these shifts reflect a national trend toward longer commute times in urban centers – a signal that, despite the persistence of hybrid work, many cities are once again grappling with the logistical and infrastructural challenges of a largely in-person workforce.
Tulsa, OK Commuters Spend the Least Amount of Time on the Road
In 2024, the cities with the shortest average commutes continued to offer residents a notable advantage in convenience and quality of life, but several experienced meaningful shifts in both travel times and rankings. Tulsa, OK, emerged as the clear leader, same as last year, despite a slight increase from 19.1 minutes in 2023 to just 19.7 minutes in 2024. Despite the fact that Omaha, NE, held its 20-minute average commute from the previous year, it fell in second place, one spot higher than the year before – one of the few cities to see no change in commute duration.
Further down the list, Memphis, TN, saw a modest increase in travel times, rising to 21.4. However, Tucson, AZ, and Kansas City, MO, each improved enough to climb in rank, with Tucson rising five spots and Kansas City moving up two, both now averaging around 21.7 to 21.8 minutes. However, not all cities fared as well, with Minneapolis, MN, once a standout for improving its commute efficiency, dropping four places in the rankings after its average travel time increased from 21.0 to 22.8 minutes. Similarly, Columbus, OH, slipped one positions as its commute rose from 21.1 to 22.2 minutes. Overall, while a few cities are successfully reducing travel times, many others are beginning to experience slight slowdowns, hinting at the reemergence of congestion pressures even in places traditionally known for easier commutes.
Top West Cities: Commute Time and Workforce Distribution
In 2024, Western U.S. cities continued to lead the nation in commute time savings compared to pre-pandemic patterns, with several urban centers maintaining notable reductions despite modest increases from 2023. Oakland, CA saw the greatest improvement overall since 2019, with average one-way travel times down by 3.2 minutes, translating to about 27 hours saved annually. San Jose, CA followed closely, trimming 3.0 minutes from the daily commute and giving residents back the equivalent of roughly 25 hours a year of non-commuting time. These time savings align closely with major jumps in remote work. Oakland’s share of remote employees climbed by 12.8 percentage points since 2019, while San Jose’s rose by 8.6 points, underscoring how hybrid work patterns continue to reshape urban mobility across the Bay Area.
Meanwhile, San Francisco, CA and Seattle, WA each recorded an average 2.5-minute drop in commute times since 2019, saving workers an estimated 21 hours annually. Despite San Francisco’s slightly lower share of remote workers, travel times remain significantly above those in Seattle, reflecting lingering congestion and high-density commuting corridors. Overall, Western cities demonstrate that even small daily reductions in commute times, when paired with widespread remote work adoption, translate into meaningful time savings and improved work-life balance across the region.
Top South Cities: Commute Time and Workforce Distribution
Raleigh, NC leads the Southern region when it comes to time savings, with residents reclaiming about 12 hours annually thanks to a 1.4-minute drop in average one-way commute time since 2019. Atlanta, GA and Baltimore, MD followed closely, each saving roughly 11 hours per year as travel times fell by 1.3 minutes. These improvements reflect a significant shift in daily mobility, suggesting that more flexible work arrangements and evolving traffic patterns are continuing to ease the commuting burden.
At the same time, the growing prevalence of remote work has amplified these gains. Since 2019, the share of employees working from home has more than doubled across all three cities, rising by 11.3 percentage points in Raleigh, 16pp in Atlanta and 9.5pp in Baltimore. This widespread adoption of remote and hybrid models has helped reduce peak-hour congestion and made everyday travel more manageable. Even in Baltimore, where commute time remains among the highest in the region at 30.2 minutes, the 11 hours saved annually translate to nearly a full workday regained over the course of a year. Together, these time savings signal that the South’s shift toward greater work flexibility is delivering measurable benefits in how people move through their day.
Top Northeast Cities: Commute Time and Workforce Distribution
In the Northeast, New York City and Philadelphia, PA each saw average one-way commute times shorten by 1.1 minutes since 2019, translating into about nine hours saved annually for the typical commuter. These reductions, while modest, represent meaningful time regained in two of the region’s most congested urban areas. For many workers, the increased adoption of flexible and hybrid work schedules has been key in alleviating peak-hour strain and providing measurable relief from the daily grind.
Boston, MA tells a slightly different story. While its average one-way commute increased marginally, rising by 0.5 minutes in 2024 compared to 2019, it remains among the more manageable commutes in the Northeast, averaging 31.7 minutes in 2024. Across all three cities, remote work participation has surged dramatically, with the share of at-home workers roughly tripling since 2019. Boston saw the largest jump, up 11.4 percentage points, followed by Philadelphia at 9.3pp and New York City at 7.9pp. This widespread shift toward remote and hybrid work continues to shape commuting behavior across the region, helping millions of Northeastern workers save valuable hours each year, even as city travel patterns begin to normalize.
Top Midwest Cities: Commute Time and Workforce Distribution
Detroit, MI stands out with the greatest improvement in the Midwest, as average travel times dropped by 2.5 minutes in 2024 compared to 2019, saving commuters roughly 21 hours per year. Chicago, IL followed with a 1.8-minute reduction, giving back around 15 hours annually, while Minneapolis, MN commuters gained back about 11 hours thanks to a 1.3-minute decline.
Remote work adoption has been a major driver behind these time savings. In 2024, the share of workers primarily working from home has more than doubled across all three cities compared to 2019. Minneapolis saw the most significant increase, up 13.8 percentage points, followed by Chicago (11.4pp) and Detroit (6.3pp). Even modest cuts in commute times translate into valuable extra hours each year, underscoring how hybrid work models and evolving travel habits continue to enhance work-life balance in the Midwest.
Conclusion – Remote Flexibility Meets the Return to the Road
Across the United States, how people get to work – and how often they do – continues to evolve. The rise of remote and hybrid work dramatically reshaped commuting habits, leading to sharp declines in travel times during the pandemic years. Yet as more employees return to the office, commute durations are climbing again, in some cases more quickly than before. This rebound underscores how closely commuting patterns are tied to shifting workplace norms and expectations.
Although the average American commute remains slightly shorter than it was pre-2020, the recent uptick signals that without continued investment in flexible work policies and transportation improvements, many regions could face renewed congestion and longer travel times. The widening gap between cities that have sustained shorter commutes and those where travel times are growing highlights the importance of smart transportation planning and adaptable work structures. Ultimately, the future of work will likely balance both worlds – the convenience of remote options and the realities of in-person collaboration – shaping not only how Americans work, but how much of their day is spent simply getting there.
Methodology
- For this analysis, we looked at data from the U.S. Census Bureau from the American Community Survey 1Y Estimates for 2019, 2023 and 2024.
- The analysis includes the top 50 largest U.S. cities by population.
- Travel time to work refers to the total number of minutes that it usually takes a worker to get from home to work (one way) each day during the reference week, for all means of transportation.
- The term “commuters” refers to workers 16 and over who do not work at home.
- To determine the time saved when commuting in a year, we estimated an average number of 250 working days in a year, with the assumption that travel time to and from work are equal.
- The change in the number of work from home workers was calculated as a difference in their number and as a growth rate (%). The percent change from year to year was calculated in percentage points (ppt).
2024 vs. 2019 Commute Times & Remote Workforce Distribution in the 50 Largest U.S. Cities
The table below presents commute time data on all 50 U.S cities included in this analysis, in decreasing order of commute time saved in 2024 compared to 2019. For a more complete analysis, the data for 2023 is also included.
The table below presents remote workforce data on all 50 U.S cities included in this analysis, in decreasing order of the share of work from home workers in 2024. For a more complete analysis, the data for 2023 is also included.
Fair Use & Redistribution
Feel free to reuse, host or repost the images in this article. When doing so, we only ask that you provide attribution to the authors by linking to YardiKube.com or this page, so that your readers can learn more about this project, the research behind it and its methodology.
Yardi Kube is an all-in-one coworking space management platform that helps businesses manage all aspects of flexible workspaces, from meeting room and space booking to lead generation, payment processing and more. For more information, click below to schedule a demo.

Sanziana Bona
Sanziana Bona is a content marketing writer specializing in commercial real estate technology for Yardi Kube, an all-in-one coworking and flexible workspace management platform, and Yardi Corom, a cloud-based solution built for commercial tenants and corporate occupiers. With a strong focus on the evolving needs of occupiers and workspace operators, she develops in-depth, research-driven content that translates complex industry topics into clear, actionable insights. Her expertise spans occupancy analytics, portfolio optimization, FASB and IFRS lease accounting compliance, coworking operations and the growth of flexible and hybrid work environments. Her work has been featured in CNBC, CBS News, NBC New York, The Press Democrat, Wolf Street and The Registry San Francisco, among others. You can connect with Sanziana via email.